


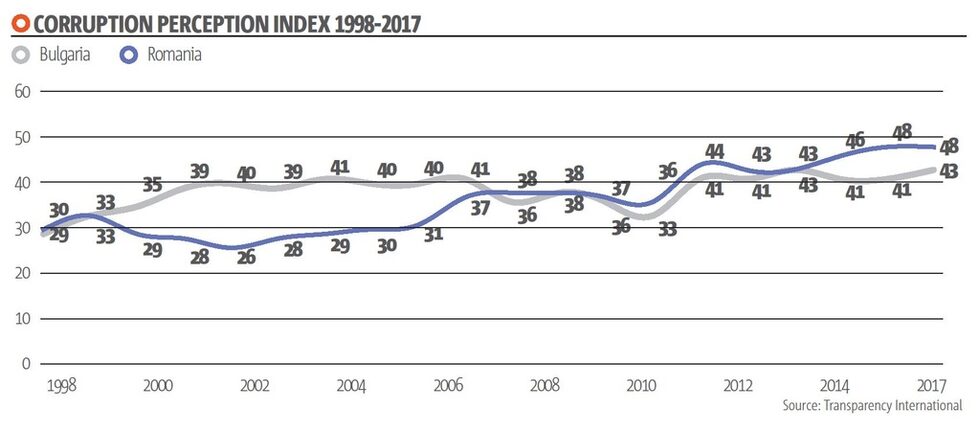
The view that Bulgaria is the most corrupt EU country is widespread. It is based on data of Transparency International (TI), which is the most widely used analysis mainly because it covers most countries in the world. TI data paints a discouraging picture of Bulgaria. It is not only the last on the ranking, but compared to Romania (fig. 3), the country has been lagging behind since 2014.
However, the TI's Corruption Perception Index (CPI) has one major flaw - it relies on perceptions, rather than on actual experience with specific corruption practices. This blurs the picture a bit, because there are some cultural factors at play - how much people are used to compare themselves to other countries, or how much they regard corruption as a bad thing.
Is Bulgaria really in the lead of the negative EU28 ranking?
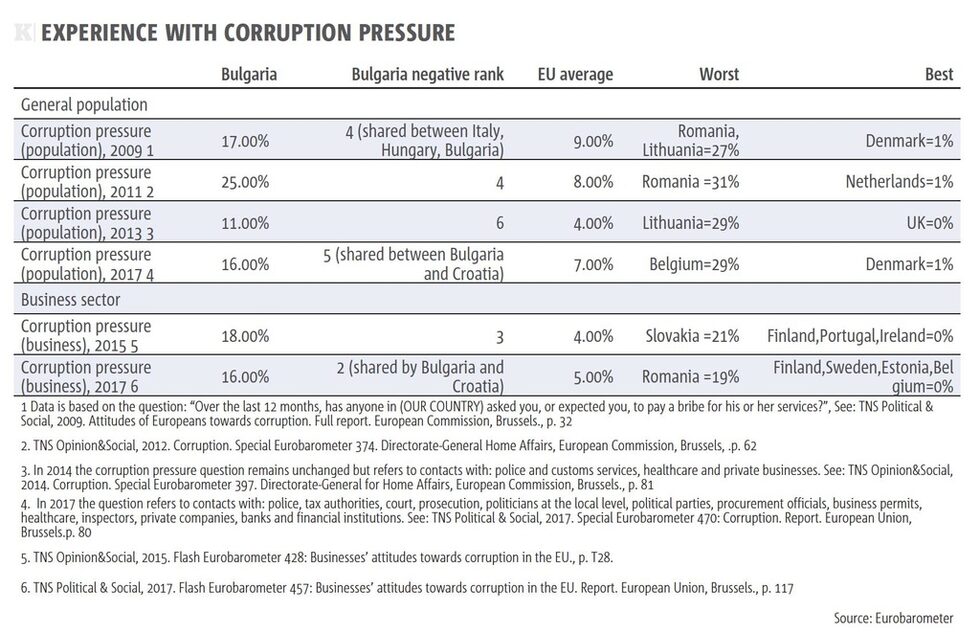
In 2005, within the regular public opinion survey Eurobarometer, the European Commission introduced a new corruption indicator based on experience with corruption (cases of offering/pressure to give bribes, gifts or favors in order to receive some services). Eurobarometer carried out the first survey that covers Bulgaria alongside the rest of EU member states in 2009. Surprisingly, the latest one conducted in 2017 (table 1) shows that the leading position in the negative ranking (the worst values standing at the top) does not belong to Bulgaria but to Belgium. In Bulgaria, 16% of the adult population admits having experience with corruption pressure which puts the country in 5th place (shared with Croatia). As noted, Belgium leads with 29%, while the EU-28 average is 7%. As usual, the best value is observed for Denmark (1%). From 2009 to 2017 the position of Bulgaria in the negative ranking varies between 4th and 6th place.
The Eurobarometer business surveys show that when it comes to corruption pressure in the business sector, Bulgaria again ranks higher than the EU-28 average. In 2015, Bulgaria occupied 3rd place in the negative ranking and in 2017 the country shares the 2nd place with Croatia. In 2017, 16% of business leaders' admit experiencing corruption pressure; the EU-28 average stands at 5%, the best value observed is 0% (Finland, Sweden, Estonia and Belgium) and the worst value of 19% belongs to Romania.
The top corruption practices most often mentioned by business leaders in Bulgaria are: funding political parties in exchange for influence in policy making (47%), bribes (42%), tax/VAT fraud (33%) and kickbacks (33%).
The indisputable fact that the high levels of experience with corruption observed in Bulgaria are not the highest in the EU is somehow comforting. However, these data, as well as the CPI values of TI show that Bulgaria is among the members of the EU with a serious and unacceptable corruption problem. In short: not the worst, yet a chronic problem.
Greasing the wheels of the bureaucracy
The series of measurements of administrative corruption conducted in Bulgaria by the Center for the Study of Democracy (see the box) show inconsistent trends (fig. 1 and fig. 2). General population trends are unstable: higher levels of administrative corruption are followed by periods of decrease. Overall, there is a clear correlation between corruption levels and the political cycle (parliamentary elections).
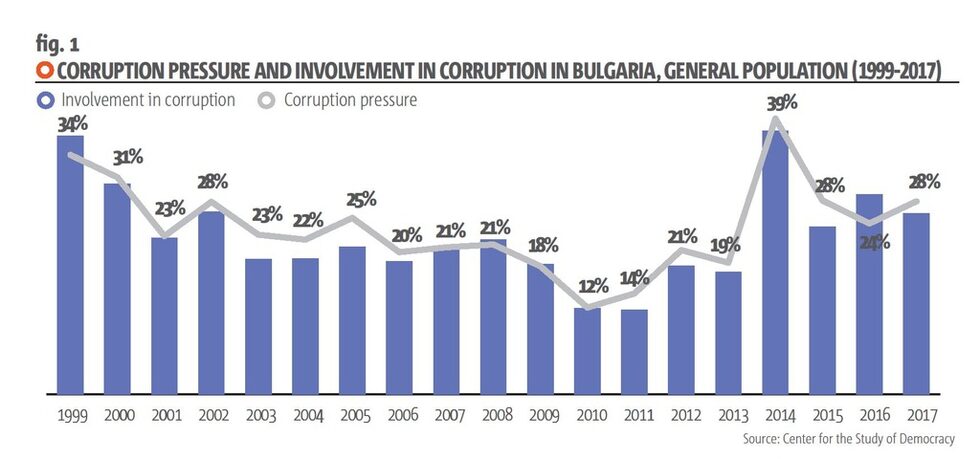
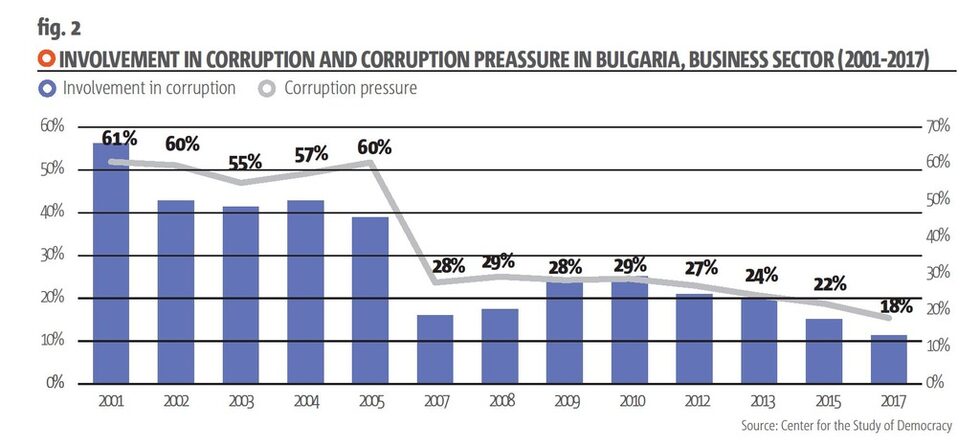
Comparing the values of corruption pressure (proposals or hints that "something has to be paid") and involvement in corruption (admission that a bribe has been paid) over time shows that both indicators have identical values in 2002 and 2017: 28% and respectively 20% of the adult population of the country have had experience (at least once) with these two corruption practices in the course of the respective year.
The extrapolation of these values (given that the adult population of Bulgaria is 6.5 mn) shows that approximately 1.2 mn cases of administrative corruption have been observed in the course of one year. By comparison, the number of crimes registered by the Ministry of the Interior during the same period varies in the range 100-150 thousand per year (including corruption). In addition, victimization surveys report a victimization rate varying in the range of 10%-14% of adult population.
Administrative corruption trends
First, if the principle approach to countering corruption is judicial sanction (complaint, investigation, arrest, trial, conviction), then it is quite obvious that the current capacity of law enforcement authorities is well below the required levels - there is wide gap between100-120 thousand registered crimes (2017) versus approximately 1.2 mn reports of administrative corruption.
Second, in the period since 1999, no consistent downward trend of administrative corruption has been observed. The lowest corruption pressure value (12%) was seen during the time of the first government of conservative GERB party in 2010. In 1999, the value of corruption pressure observed was 34%, while in 2017 the value is 28%. The situation in 2017 is identical to the situation 15 years earlier.
Third, the observed corruption experience values of this magnitude (Eurobarometer) obviously surpass the EU average and show that the country has a systemic corruption problem. Practically this means that corruption pressure is assumed by everyone, that many public officials rely on corruption for additional income and that the higher levels of the bureaucracy do not effectively control their subordinates but rather the opposite occurs - public officials in non-managerial positions control the bureaucracy and effectively block even shy reform attempts.
The situation in the business sector is different: corruption here is clearly on the decline, especially after Bulgaria joined the EU in 2007 (fig. 2). An important factor in this respect is the substantial reduction of customs procedures related to the entry into the EU's single market. However, compared to other EU-28 countries, Bulgaria, along with Romania, Croatia and Slovakia competes for the last position in the ranking.
Some general conclusions
The existence of corruption indicates that important societal systems are not properly functioning, i.e. there is a shortage of mechanisms which automatically balance the divergent interests of citizens and businesses. More generally, instead of predominantly relying of public moral norms and markets to decide on priorities of interests, the bureaucracy and the public officials acquire an increasing number of arbitration rights through newer laws and additional control responsibilities. Unlike automatic mechanisms, administrative arbitration is subject to evolving bias resulting from economic, political and other influences.
Systematic corruption tolerated for longer periods of time tends to foster its own forms of organization and superstructures - e.g. state capture (the organized use of different forms of corruption that aims to create privileged actors who are in turn able to extract monopolistic rents from most of their endeavors). This new phenomenon has already been analyzed by the Center for the Study of Democracy, including the use of state capture as a tool to superimpose interests of foreign countries. These analyses describe a number of examples how foreign and domestic investment, through state capture, essentially privatizes state functions and regulatory mechanisms and leads to stable reorientation of public bureaucracy mechanisms towards serving specific private and/or group interests.
The judicial forms of countering corruption and state capture are not something that any state can neglect. In a systemic corruption environment, however, these measures have limited potential. Rather, the urgent necessity is to fundamentally restructure the modus operandi of public authorities which widely open the doors for corruption influences. This restructuring is, however, a matter of political choice and resolute desire of a society to reinvent itself. Which are probably not there yet.
*Alexander Stoyanov is research director of the Center for the Study of Democracy.
The view that Bulgaria is the most corrupt EU country is widespread. It is based on data of Transparency International (TI), which is the most widely used analysis mainly because it covers most countries in the world. TI data paints a discouraging picture of Bulgaria. It is not only the last on the ranking, but compared to Romania (fig. 3), the country has been lagging behind since 2014.
However, the TI's Corruption Perception Index (CPI) has one major flaw - it relies on perceptions, rather than on actual experience with specific corruption practices. This blurs the picture a bit, because there are some cultural factors at play - how much people are used to compare themselves to other countries, or how much they regard corruption as a bad thing.


